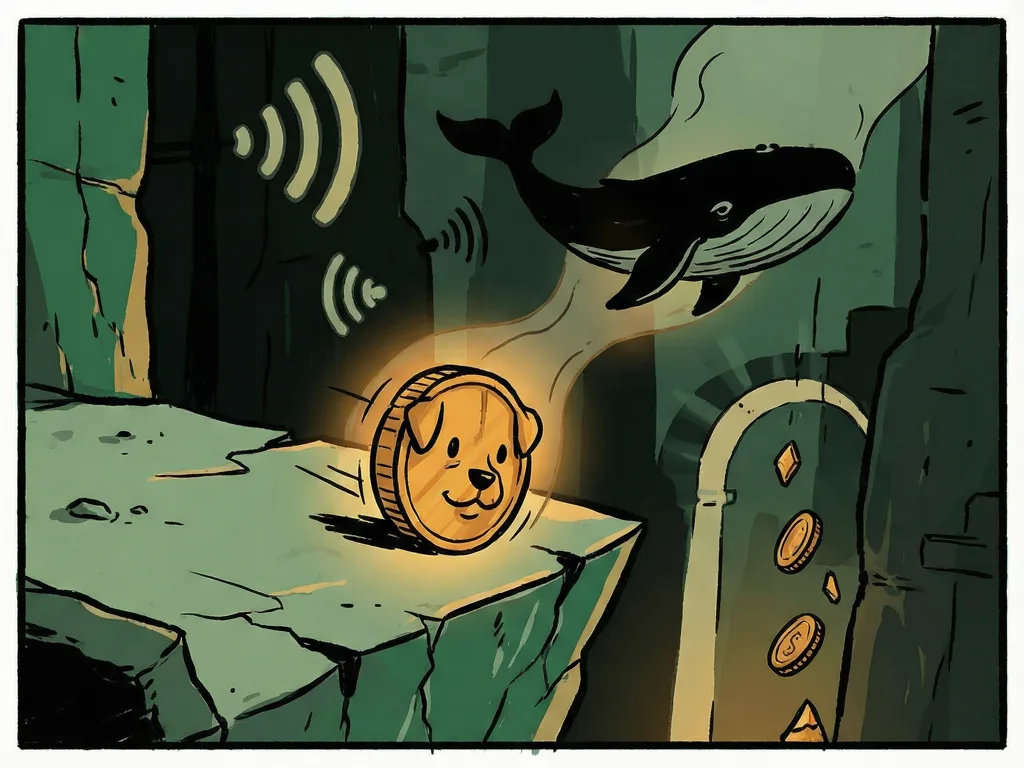
Dogecoin traded near $0.085 on Friday after losing more than 11% this week. At the same time, on-chain analytics provider Santiment reported that two groups of large wallets reduced their combined balances by 100 million DOGE since Tuesday. Market data providers CryptoQuant and CoinGlass added more signals, while technical commentary pointed to levels such as $0.084, $0.078 and $0.070. Here is a plain-language breakdown of what happened, why it matters, and what users can watch.
What happened to Dogecoin?
Dogecoin is a meme-inspired cryptocurrency that launched in 2013 and often moves quickly with broader market sentiment and social attention. Its price was around $0.085 on Friday, following a weekly decline of more than 11%. The asset was described as approaching a key trendline area.
The recent weakness came with two notable developments. First, large-wallet balances fell. Second, technical momentum weakened. Data providers also showed a mixed derivatives picture: some positioning data suggested traders were leaning toward a possible bounce, but the overall signal was not clear enough to remove downside pressure.
Why do the 100 million DOGE wallet changes matter?
Santiment's supply distribution data focused on two cohorts: wallets holding between 1 million and 10 million DOGE and wallets holding between 10 million and 100 million DOGE. These cohorts collectively reduced their balances by 100 million tokens since Tuesday.
For newcomers, large wallets are often watched because a smaller number of addresses can move a meaningful amount of supply. A drop in balances can suggest that some holders are reducing exposure, potentially through profit-taking. But wallet changes alone do not confirm that every token was sold. Coins may move between personal wallets, to custodial accounts, or into exchange balances. The report treated the movement as a sign of possible supply pressure, not as proof of selling.
What are CryptoQuant and CoinGlass showing?
CryptoQuant's summary indicators pointed to caution. The provider described overheating conditions in both spot and futures markets, alongside large orders and sell-side dominance in futures. In simple terms, this means the data suggested that sellers had the stronger hand in parts of the market while DOGE moved near nearby support.
CoinGlass's DOGE long-to-short ratio stood at 0.90 on Friday, approaching its highest level in more than a month. This ratio compares tracked long positions with tracked short positions. A reading above one indicates that longs outnumber shorts within the positions or accounts tracked by the metric. At 0.90, the ratio remained below that threshold but was higher than recent readings.
Funding rates also remained positive at 0.0010%. In perpetual futures markets, funding is a payment mechanism between long and short traders. A positive rate means long traders were paying short traders to maintain their positions. That can reflect expectations of a recovery, but it does not establish that buying demand is strong enough to reverse the decline, especially while price momentum remains weak.
Why are $0.084, $0.078, $0.070 and other levels mentioned?
The technical discussion treated $0.084 as an immediate trendline support reference. Dogecoin was described as trading just above that area.
The report also listed $0.078 and $0.070 as deeper structural floors in its technical section. In addition, resistance was noted as beginning at $0.086 and extending to $0.088. The price was described as below several exponential moving averages, including the 20-day and 50-day EMAs. Higher levels of $0.093 and $0.102 were also mentioned in the technical commentary.
The Relative Strength Index sat near 40, below its neutral midpoint and consistent with weaker momentum. These levels are reference points used by technical watchers. They are not guarantees of future price movement.
What does this mean for users?
For readers who follow cryptocurrency markets, the main takeaway is that different signals are pointing in different directions. Large-wallet reductions and CryptoQuant's futures data highlighted supply and selling concerns. CoinGlass's long-to-short ratio and positive funding rate showed some traders were still positioned for a bounce.
For users who trade or hold DOGE through exchanges or derivatives platforms, the practical point is to understand what each metric represents. Spot price movements, wallet balances, funding rates, long-to-short ratios, support references, and moving averages are tools for reading market behavior, not instructions for action. Exchanges and derivatives venues can amplify risk through margin, liquidation mechanisms, and funding payments, so position size and account exposure matter.
Dogecoin's recent week shows how a price move, on-chain balance changes, and derivatives positioning can be read together. No single number gives a full answer, but the mix of data helps newcomers see where pressure, caution, and possible buyer interest may be coming from.
Comments 0